 INCISOR®
Before you start
Incisor 2026.10.26.15.33.40 or later
Editor debugging isn't available in earlier versions. Use Incisor menu → Check for Updates to update.
Source maps on
Your breakpoints map to your own files through source maps. In Project Settings, keep generateSourceMaps on, and turn removeComments and removeWhiteSpace off for the configuration you're running.
Whitespace removal must be off for now. Soon, whitespace removal will only happen when you publish, and this requirement will go away.
Know the risk. The debugging port is only open to your own computer, but any program on that computer, including programs run by other user accounts, can connect to it and run code inside your projects. Turn it on only on a machine you trust, and turn it off when you're done debugging.
1Turn on editor debugging
This step is the same whichever editor you use.
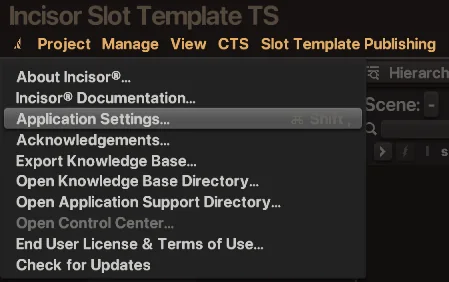
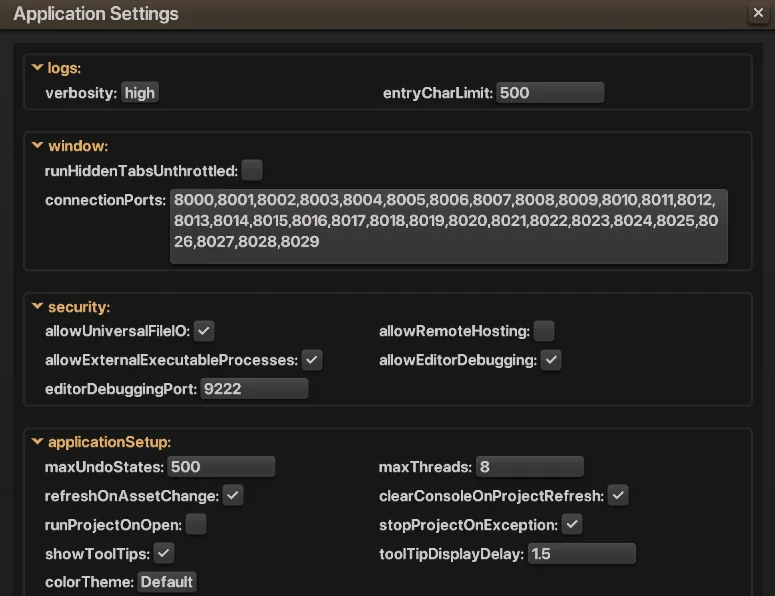
- Open Application Settings from the Incisor menu (the logo at the far left of the menu bar).
- Under security, tick
allowEditorDebugging. Incisor asks you to confirm that you accept the risks. Choose Yes.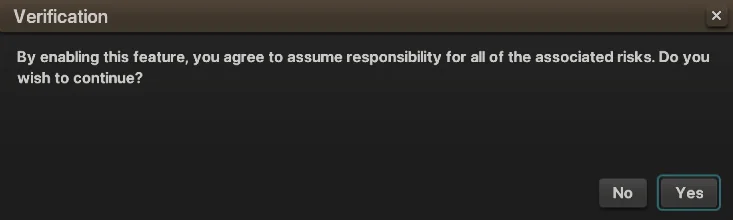
- Leave
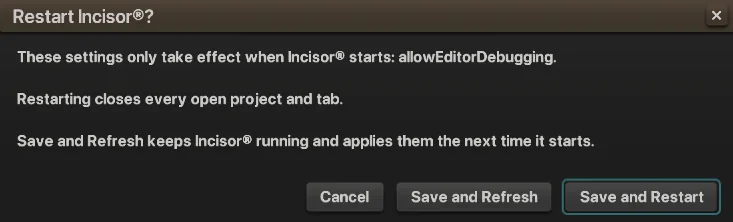
editorDebuggingPortat 9222 unless another program on your computer already uses that port. Any whole number from 1024 to 65535 works. - Press Save and Restart. Both settings take effect only when Incisor starts. Save and Refresh keeps Incisor running and applies them the next time it starts.
2Connect your editor
Every editor connects to the same port. Only the setup is different.
VS Code
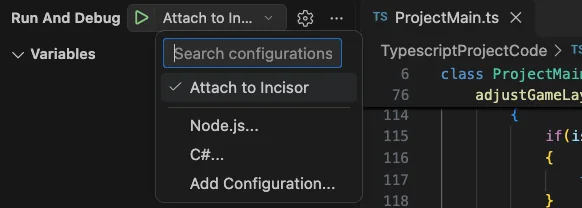
When you open a project with editor debugging on, Incisor adds an Attach to Incisor configuration to the project's .vscode/launch.json. All you have to do is start it.
- Open the project folder in VS Code (the folder itself, not a parent folder), so VS Code finds the project's
.vscodefolder. - Go to Run and Debug, choose Attach to Incisor from the dropdown, and press the green play button (or F5).
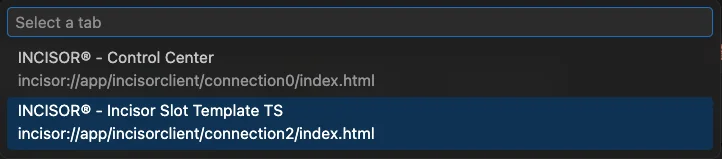
- VS Code lists the open Incisor tabs. Pick your project, not the Control Center.
- Click in the gutter to set a breakpoint in one of your files, then run the code that reaches it.
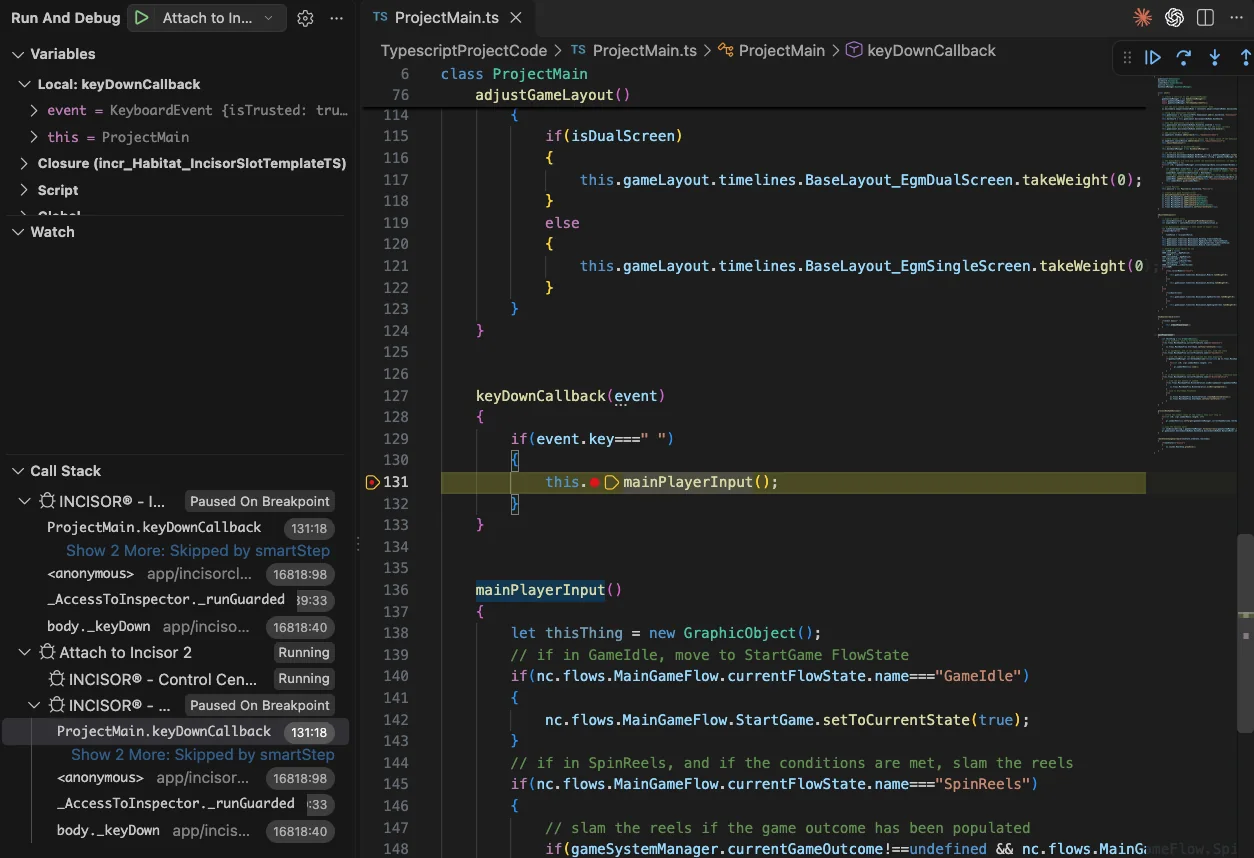
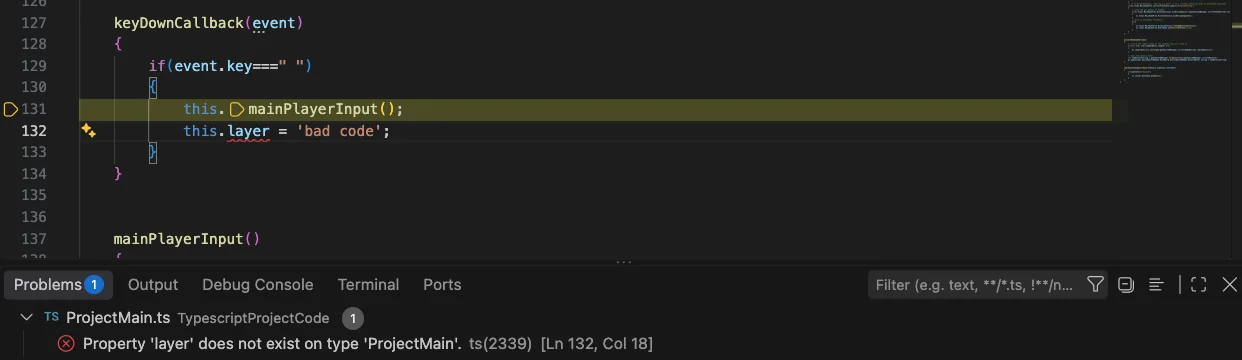
ProjectMain.ts. The Variables and Call Stack panels show your own TypeScript, not compiled output.What Incisor writes for you
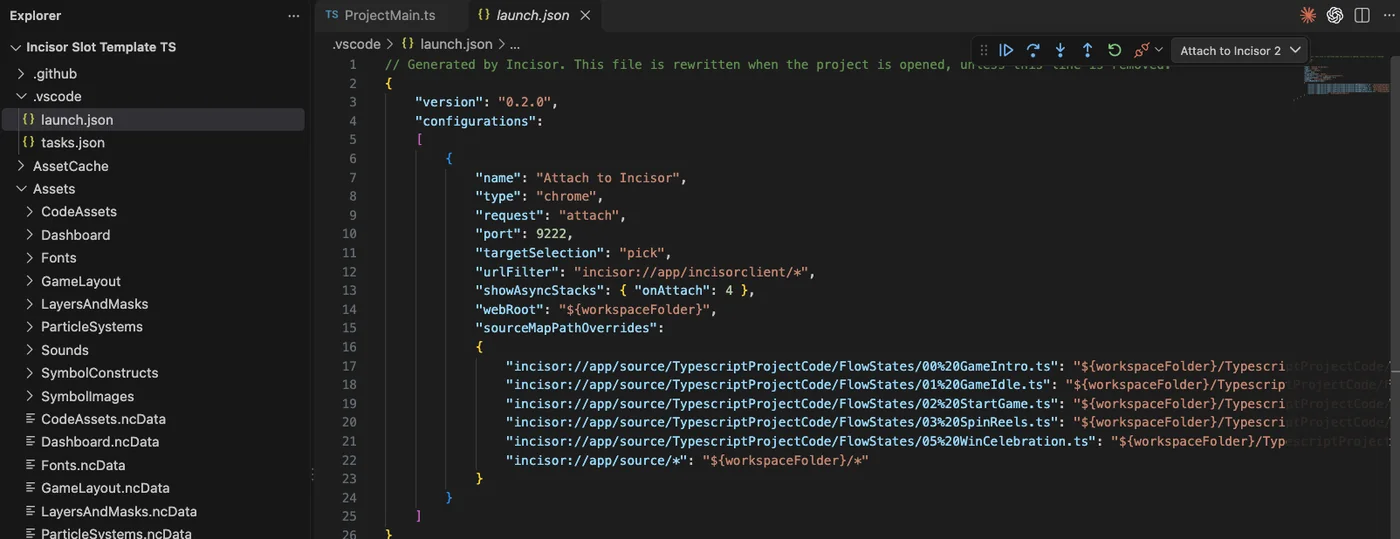
- launch.json: the Attach to Incisor entry is kept current by Incisor, including your port and the source-map paths for your files. Any other configurations you add are left alone.
- tasks.json (TypeScript projects): an Incisor TypeScript Check task runs when you open the folder and keeps watching your files. Type errors appear in the Problems panel as you work. Your own tasks are left alone too.
WebStorm
WebStorm attaches with its built-in Attach to Node.js/Chrome configuration. You set it up once per project.
- Open the project folder in WebStorm.
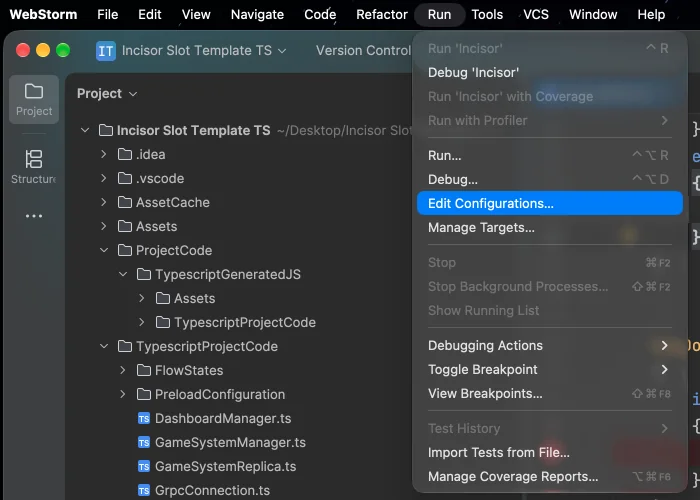
- Choose Run → Edit Configurations...
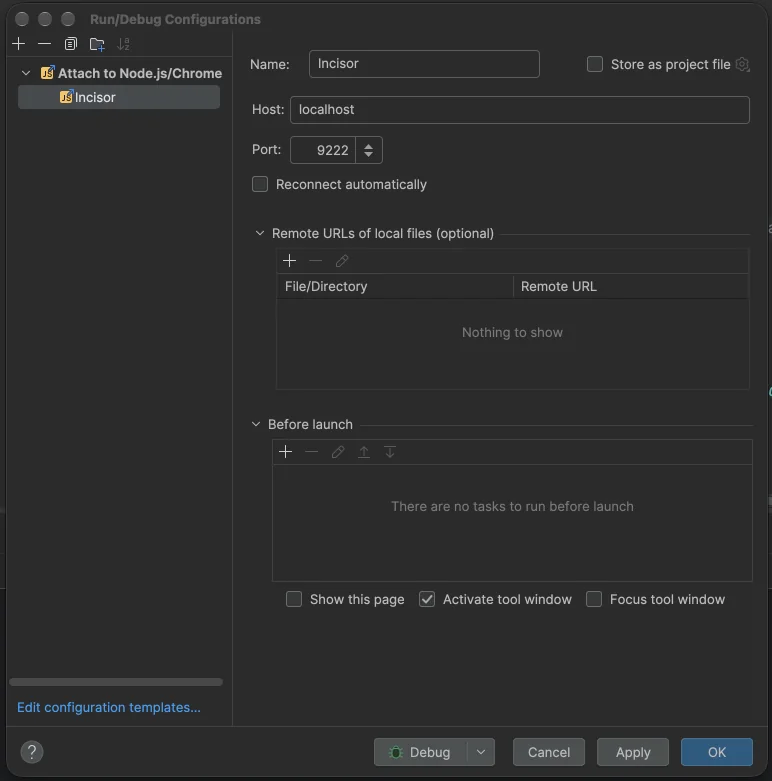
- Press + and choose Attach to Node.js/Chrome. Give it a name such as Incisor, leave Host as
localhost, and set Port to youreditorDebuggingPort(9222 by default). Leave everything else as it is and press OK.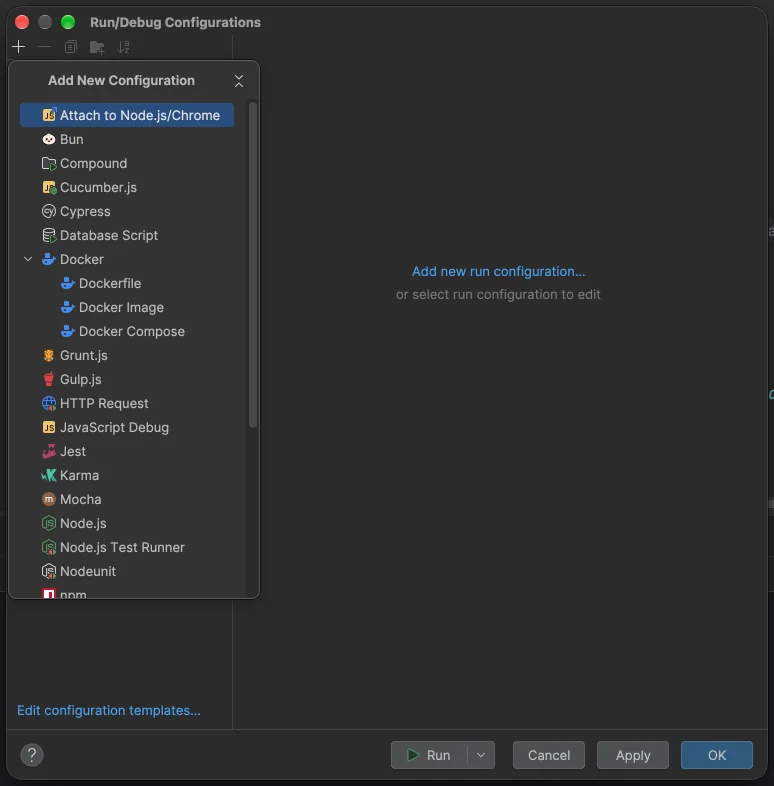
- Select Incisor in the run configuration dropdown and press the Debug button (the bug), or choose Run → Debug 'Incisor'. WebStorm lists the Incisor pages. Pick your project, not the Control Center or the tab bar.
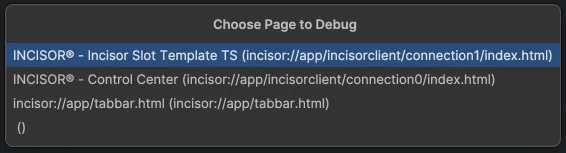
- Click in the gutter to set a breakpoint in one of your files, then run the code that reaches it.
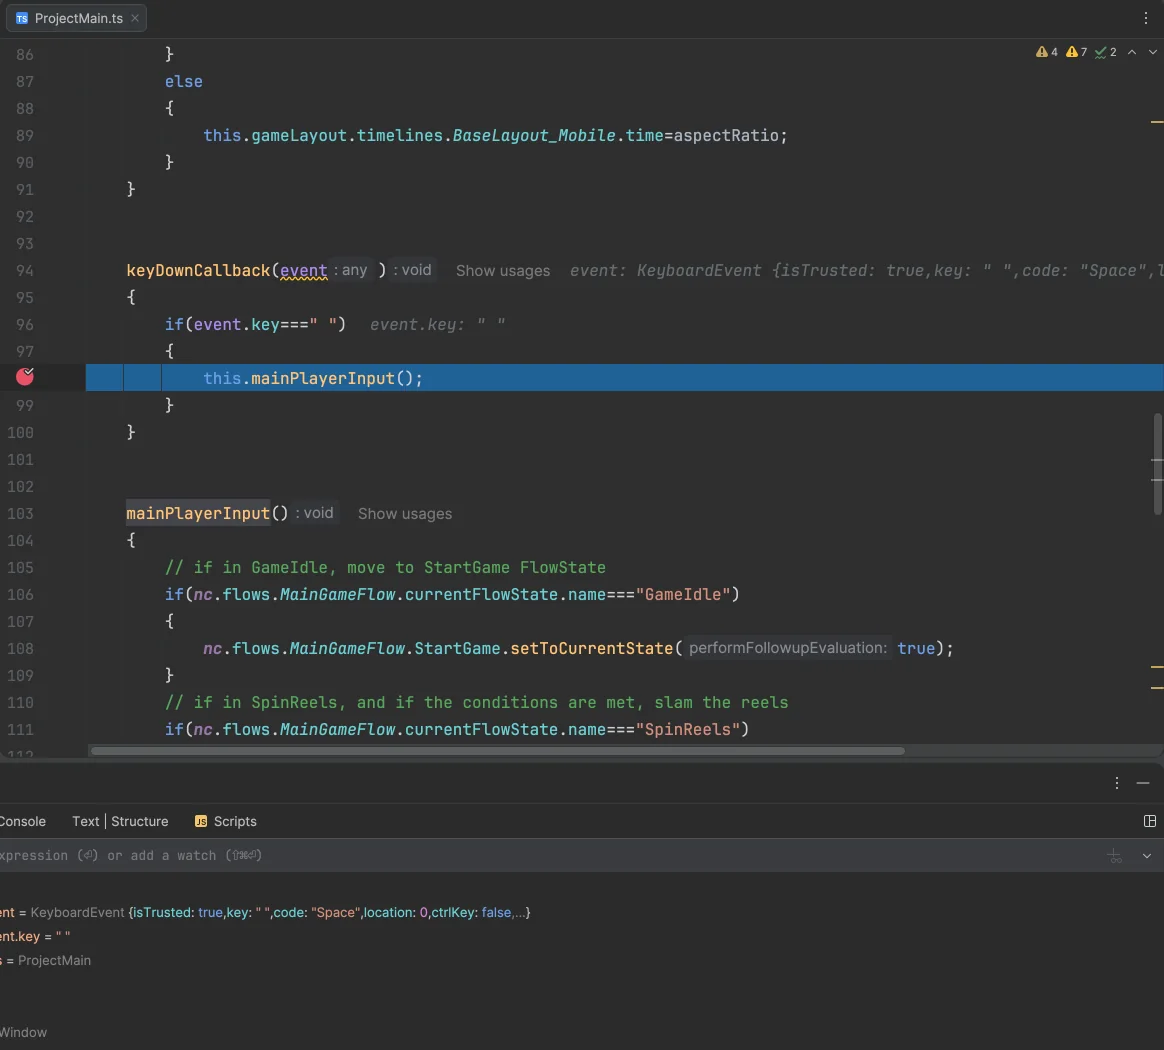
ProjectMain.ts, with the call stack and variables in Threads & Variables.Incisor doesn't write this configuration for you, as it does for VS Code. If you change editorDebuggingPort, update the port here too.
Incisor's console, in WebStorm
While attached, the Console tab of the Debug window shows your project's console output, including the TypeScript errors Incisor reports.
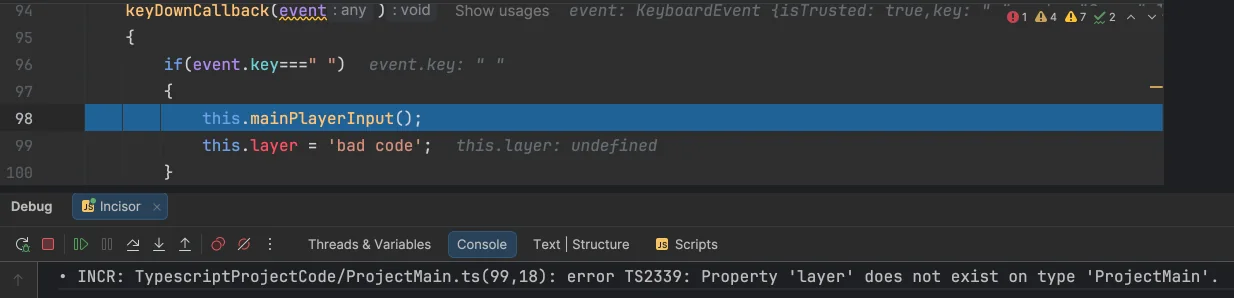
Good to know
Projects open stopped (by default), so press Run
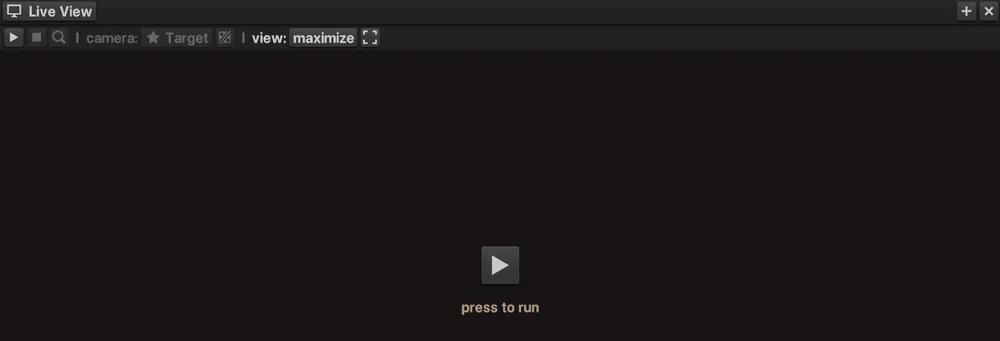
Nothing runs until you press Run in Live View, which gives you time to attach and set breakpoints before your startup code runs. To have projects start running as soon as they open, turn on runProjectOnOpen in Application Settings.
Choosing stopProjectOnException
This Application Setting decides what happens when your code throws an error:
On
Incisor stops the project at the error. This keeps the Incisor inspector running smoothly, so it's a good everyday setting.
Off
The project keeps running past the error, so you can watch what happens next in your debugger. Use this to track down the trickier bugs.
Troubleshooting
“Editor debugging port in use”
Incisor shows this when another program already holds the port. Your editor can't attach until Incisor opens its own port. Pick a different editorDebuggingPort in Application Settings and restart Incisor. In VS Code, the Attach to Incisor configuration picks up the new port automatically.
No “Attach to Incisor” in VS Code
- You're on Incisor 2026.10.26.15.33.40 or later.
allowEditorDebuggingis on and Incisor has been restarted since you turned it on.- Source maps are on:
generateSourceMapson,removeCommentsandremoveWhiteSpaceoff. - You've opened the project in Incisor since then (that's when the configuration is written), and VS Code has the project folder itself open.
Breakpoints don't get hit
- You picked your project's tab, not the Control Center.
- The project is running (press Run in Live View).
- Source maps are on, as above.
My port setting was ignored
The port must be a whole number from 1024 to 65535. Anything else falls back to 9222.